


Last modified: August 26, 2021

Cybernetics, Kuramoto, Heart Rate Variability, Live Complexity Training (EEG Biofeedback)
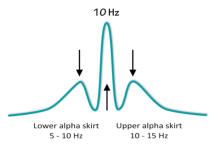
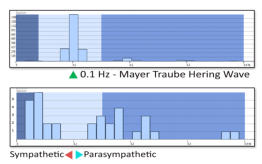
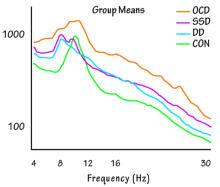
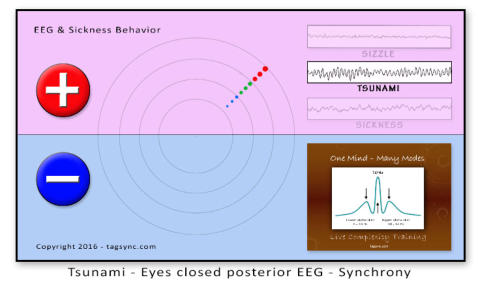
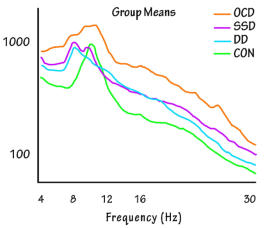
In addition to creating cybernetics, a great deal of signal analysis, and doing the first qEEG, Norbert Wiener speculated that the brain functioned best when its slow and fast electrical oscillators were “pulled” toward a single control frequency, namely 10 Hz (cycles per second) [1]. The 10 Hz brain wave (EEG) is a harmonic of the 0.1 Hz body wave called the Mayer-Traube-Herring wave. The frequency 0.1 cycles per second is the same thing as 6 cycles per minute. The neural networks of the brain developed in an environment shaped by this rhythm. It is the resonant frequency observed in heart rate variability (HRV) studies. Here we will talk about the “power spectral displays” of the EEG and the HRV signals. The power spectral display (PSD) is a graph that shows the amounts of power produced in the low, medium, and high frequency ranges. In the illustration to the left you see the natural organizing tendency of the EEG represented by the arrows. This organization is best seen in the eyes closed EEG. The organization obeys the Constructal Law of Physics and generates complexity. The dissipation of the EEG during sickness behavior or during intrusions of sleep fragments is primarily a flow reversal into the lower and upper alpha skirts. [2] Live Complexity Training is a type of EEG biofeedback (neurofeedback) that monitors dissipation of energy into the alpha skirts and trains toward visible increases in the complexity of the EEG. The Graphs on the left were produced by the EM Wave Pro during heart rate variability (HRV) biofeedback. These graphs may change rapidly during a session. They show the power spectral display - the amount of energy produced by low, medium and high frequencies - that contribute to the moment-by-moment changes in heart rate. The top graph shows my PSD centered at the resonant frequency. The lower graph shows a client who has lost central (0.1 Hz) control and could reasonably be said to have one foot on the gas (sympathecotonia) and one foot on the brake (parasympathecotonia) [3]. Below we see an important example of the power dissipated in the EEG at various frequencies in the healthy CON (control - green) and in three types of sickness behavior. “DD” is depressive disorder, “SSD” is schizophrenia spectrum disorder, “OCD” is obsessive-compulsive disorder. For our purposes they can all be called “sickness behavior. There is a clear difference in the EEG patterns of wellness and sickness behavior. With increasing sickness behavior the EEG shows 1) loss of a sharp 10 Hz control signal; and 2) increased dissipation of energy in the upper and lower alpha skirts and in the low and high frequency bands in general [4]. Note how as “frequency pulling” fails to maintain the sharp 10 Hz peak, the amount of energy dissipated (wasted) in the lower and upper alpha skirts increases. At the same time the complexity of the EEG decreases and is replaced by redundancies easily identifiable in the raw EEG and on the qEEG spectral display during neurofeedback. Similar patterns are also described by Ulrich [2] as a disturbance of normal “vigilance” mechanisms. I equate this particular form of EEG vigilance with complexity, both in the EEG and in the behavioral repetoire. Here we are talking about the loss of “frequency pulling” in sickness behavior. Wiener was not able to mathematically model this behavior in his lifetime. Since the introduction of the Kuramoto oscillator in the 1980s it has been shown that frequency pulling self-organizes when individual oscillators share certain data [5, 6]. In fibromyalgia, for example, the heart rate variability curve is shifted to the left (the lower HRV skirt) and the EEG is also shifted toward the left (the lower alpha skirt). [7]Kuramoto Oscillators - the Sizzle, the Tsunami, and the Sickness Behavior EEG
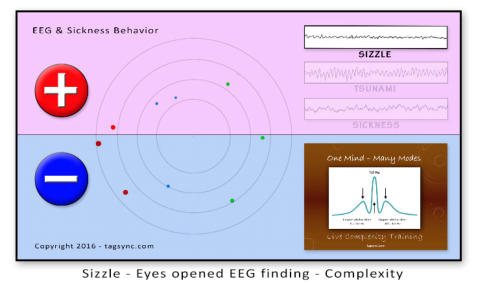
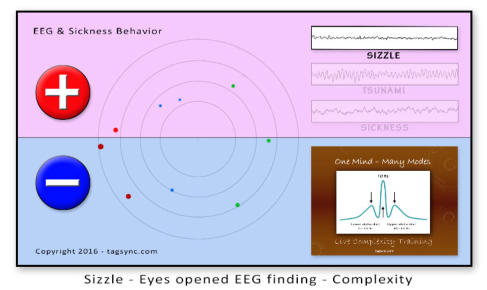
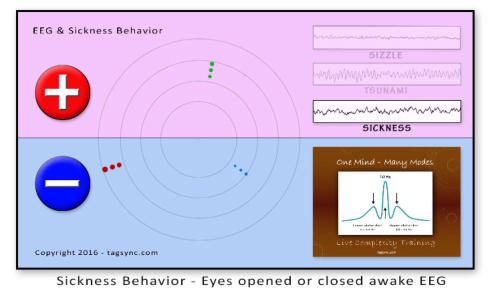
In a moment we will look at an animation of Kuramoto oscillators displaying 3 different types of behavior that I call 1) Sizzle, 2) Tsunami and 3) Sickness. Sizzle occurs all over the healthy brain with eyes open. Tsunami occurs in the healthy posterior cortex with eyes closed. Sickness behavior occurs anywhere but is especially significant in the midline. These patterns are easily identified by beginners on the spectral display and in the raw EEG during neurofeedback. The Kuramoto oscillators are described below as though they were 9 runners running clockwise around a track. They could also represent electrically charged particles running in cycles in and out of neurons and measured by scalp electrodes.. This first illustration (to the left) shows the cortical EEG “sizzle” of wellness behavior. It is characterized by increased complexity and disappearance of any clear patterns (redundancies). This is a special type of complexity generated by self-organized criticality [8]. Despite the apparent lack of any patterns in the complex EEG, it displays self- similarity over-time (memory). It is a result of each neuron performing individualized functions and exhibiting its own rhythm. In this state, at any particular time, there are about as many regions in a positively charged state as in a negatively charged state, so the EEG amplitude is low-voltage (desynchronized) and exhibits its characteristic sizzle. Libenson describes the sizzle as “non-descript” [9]. If you zoom into the complex wave you will not see smooth curves as a result of the magnification. Instead you will see constant unfolding of complexity. This is the opposite of what happens when you zoom into the EEG of sickness behavior and see the smooth curves of redundant slow waves and fast wave (below). This graphic (to the left) illustrates what I call the “Tsunami”. In wellness behavior with eyes open there is characteristic sizzle all over the cortex. But with eyes closed the posterior cortex exhibits the tsunami waves of alpha called the posterior dominant rhythm. The large amplitudes are produced by the phase synchronization of a large number of neurons. This graphic illustrates the appearance of the EEG in sickness behavior. There is dissipation of EEG energy into the lower and upper alpha skirts. Unlike the sizzle of wellness behavior, when you zoom in on the EEG you see smooth curves of the underlying slow waves in the lower alpha skirt. You also see the redundant fast waves, such as beta spindles, riding on the slow waves. The self-similarity that is observed when you zoom in or out of a complex wave is absent in the EEG of sickness behavior. The loss of long range temporal correlation (self-similarity over time) and the loss of scale-free dynamics affects timing and memory. This is the characteristic appearance of the EEG in inflammation, sleep deprivation, methylation disorders, oxidative stress, addiction, degeneration and so forth. Please click below to download a video of the Three Variations of the Kuramoto Oscillator - easily seen in raw EEG. Conclusion: I present to you the first EEG-based transdiagnostic biomarker of sickness behavior and chronic disease. In 2020 I will present a more general introduction to Live Complexity Training in the rehabilitation of sickness behavior [https://www.livecomplexitytraining.com]. We will discuss clear connections between my complexity model and the regulation of EEG, HRV, GSR, Temp, MRI, MEG, fNIR, dirty electricity. References: [1] Strogatz S (2003) - Sync: How Order Emerges from Chaos in the Universe, Nature, and Daily Life. Hyperion, N.Y. [2] Ulrich G (2013) - The Theoretical Interpretation of Electroencephalography (EEG). BMed Press, USA. [3] Dailey D (2016) - Complexity, Canonical Sickness Behavior and EEG Biofeedback. Bradley University Super Brain Summit, April 29, 2016. [4] Schulman JJ, et al (2011) - Imaging of thalamocortical dysrhythmia in neuropsychiatry. Frontiers in Human Neuroscience, 29 July. [ Free Full Text ] [5] Ibanez-Molina AJ, et al (2016) - Neurocomputational Model of EEG Complexity during Mind Wandering. Front Comput Neurosci. 2016 Mar 4;10:20 [ Free Full Text ] [6] Breakspear M, et al (2005) - Dynamics of a neural system with a multiscale architecture, Phil Trans R Soc B 360, 1051-1074. [ Free Full Text ] [7] Lim M, et al (2016) - Increased Low- and High-Frequency Oscillatory Activity in the Prefrontal Cortex of Fibromyalgia Patients. Frontiers in Human Neuroscience, 14 March. [ Free Full Text ] [8] Bak P (1999) – How Nature Works: The Science of Self-Organized Criticality. Copernicus / Springer-Verlag, NY. [9] Libenson MH (2010) - Practical Approach to Electroencephalography. Saunders, Elsevier. p 6. [10] Pacher P, et al (2007) - Nitric Oxide and Peroxynitrite in Health and Disease. Physiol Rev 97:315-424, 2007. [11] Milham S (2012) - Dirty Electricity - Electrification and the Diseases of Civilization. 2nd Ed. iUniverse Inc, Bloomington.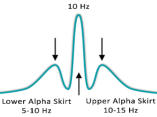


Last mod: Aug 26, 2021

Cybernetics, Kuramoto, Heart Rate Variability, Live
Complexity Training (EEG Biofeedback)
IIn addition to creating cybernetics, a great deal of signal analysis, and doing the first qEEG, Norbert Wiener speculated that the brain functioned best when its slow and fast electrical oscillators were “pulled” toward a single control frequency, namely 10 Hz (cycles per second) [1]. The 10 Hz brain wave (EEG) is a harmonic of the 0.1 Hz body wave called the Mayer-Traube-Herring wave. The frequency 0.1 cycles per second is the same thing as 6 cycles per minute. The neural networks of the brain developed in an environment shaped by this rhythm. It is the resonant frequency observed in heart rate variability (HRV) studies. Here we will talk about the “power spectral displays” of the EEG and the HRV signals. The power spectral display (PSD) is a graph that shows the amounts of power produced in the low, medium, and high frequency ranges. In the illustration to the left you see the natural organizing tendency of the EEG represented by the arrows. This organization is best seen in the eyes closed EEG. The organization obeys the Constructal Law of Physics and generates complexity. The dissipation of the EEG during sickness behavior or during intrusions of sleep fragments is primarily a flow reversal into the lower and upper alpha skirts. [2] Live Complexity Training is a type of EEG biofeedback (neurofeedback) that monitors dissipation of energy into the alpha skirts and trains toward visible increases in the complexity of the EEG. The Graphs on the left were produced by the EM Wave Pro during heart rate variability (HRV) biofeedback. These graphs may change rapidly during a session. They show the power spectral display - the amount of energy produced by low, medium and high frequencies - that contribute to the moment-by-moment changes in heart rate. The top graph shows my PSD centered at the resonant frequency. The lower graph shows a client who has lost central (0.1 Hz) control and could reasonably be said to have one foot on the gas (sympathecotonia) and one foot on the brake (parasympathecotonia) [3]. Here we see the power dissipated in the EEG at various frequencies in the healthy CON (green) and in three types of sickness behavior. “DD” is depressive disorder, “SSD” is schizophrenia spectrum disorder, “OCD” is obsessive-compulsive disorder. For our purposes they can all be called “sickness behavior. There is a clear difference in the EEG patterns of wellness and sickness behavior. With increasing sickness behavior the EEG shows 1) loss of a sharp 10 Hz control signal; and 2) increased dissipation of energy in the upper and lower alpha skirts and in the low and high frequency bands in general [4]. Note how as “frequency pulling” fails to maintain the sharp 10 Hz peak, the amount of energy dissipated (wasted) in the lower and upper alpha skirts increases. At the same time the complexity of the EEG decreases and is replaced by redundancies easily identifiable in the raw EEG and on the qEEG spectral display during neurofeedback. Similar patterns are also described by Ulrich [2] as a disturbance of normal “vigilance” mechanisms. I equate this particular form of EEG vigilance with complexity, both in the EEG and in the behavioral repetoire. Here we are talking about the loss of “frequency pulling” in sickness behavior. Wiener was not able to mathematically model this behavior in his lifetime. Since the introduction of the Kuramoto oscillator in the 1980s it has been shown that frequency pulling self-organizes when individual oscillators share certain data [5, 6]. In fibromyalgia, for example, the heart rate variability curve is shifted to the left (the lower HRV skirt) and the EEG is also shifted toward the left (the lower alpha skirt). [7]Kuramoto Oscillators - the Sizzle, the Tsunami, and the
Sickness Behavior EEG
In a moment we will look at an animation of Kuramoto oscillators displaying 3 different types of behavior that I call 1) Sizzle, 2) Tsunami and 3) Sickness. Sizzle occurs all over the healthy brain with eyes open. Tsunami occurs in the healthy posterior cortex with eyes closed. Sickness behavior occurs anywhere but is especially significant in the midline. These patterns are easily identified by beginners on the spectral display and in the raw EEG during neurofeedback. The Kuramoto oscillators are described below as though they were 9 runners running clockwise around a track. They could also represent electrically charged particles running in cycles in and out of neurons and measured by scalp electrodes.. This first illustration below shows the cortical EEG “sizzle” of wellness behavior. It is characterized by increased complexity and disappearance of any clear patterns (redundancies). This is a special type of complexity generated by self-organized criticality [8]. Despite the apparent lack of any patterns in the complex EEG, it displays self-similarity over-time (memory). It is a result of each neuron performing individualized functions and exhibiting its own rhythm. In this state, at any particular time, there are about as many regions in a positively charged state as in a negatively charged state, so the EEG amplitude is low-voltage (desynchronized) and exhibits its characteristic sizzle. Libenson describes the sizzle as “non-descript” [9]. If you zoom into the complex wave you will not see smooth curves as a result of the magnification. Instead you will see constant unfolding of complexity. This is the opposite of what happens when you zoom into the EEG of sickness behavior and see the smooth curves of redundant slow waves and fast wave (below). This next graphic illustrates what I call the “Tsunami”. In wellness behavior with eyes open there is characteristic sizzle all over the cortex. But with eyes closed the posterior cortex exhibits the tsunami waves of alpha called the posterior dominant rhythm. The large amplitudes are produced by the phase synchronization of a large number of neurons. This last graphic illustrates the appearance of the EEG in sickness behavior. There is dissipation of EEG energy into the lower and upper alpha skirts. Unlike the complex “sizzle” of wellness behavior, when you zoom in on the EEG of sickness behavior you see smooth curves of the underlying slow waves in the lower alpha skirt. You also see the redundant fast waves, such as beta spindles, riding on the slow waves. The self-similarity that is observed when you zoom in or out of a complex wave is absent in the EEG of sickness behavior. The loss of long range temporal correlation (self-similarity over time) and the loss of scale-free dynamics affects timing and memory. This is the characteristic appearance of the EEG in inflammation, sleep deprivation, methylation disorders, oxidative stress, addiction, degeneration and so forth. Please click below to download a video of the Kuramoto Oscillator - Sizzle, Tsunami and Sickness Behavior. Conclusion: I present to you the first EEG-based transdiagnostic biomarker of sickness behavior and chronic disease. In 2020 I will present a more general introduction to Live Complexity Training in the rehabilitation of sickness behavior [https://www.livecomplexitytraining.com]. We will discuss clear connections between my complexity model and the regulation of EEG, HRV, GSR, Temp, MRI, MEG, fNIR, dirty electricity, etc. References: [1] Strogatz S (2003) - Sync: How Order Emerges from Chaos in the Universe, Nature, and Daily Life. Hyperion, N.Y. [2] Ulrich G (2013) - The Theoretical Interpretation of Electroencephalography (EEG). BMed Press, USA. [3] Dailey D (2016) - Complexity, Canonical Sickness Behavior and EEG Biofeedback. Bradley University Super Brain Summit, April 29, 2016. [4] Schulman JJ, et al (2011) - Imaging of thalamocortical dysrhythmia in neuropsychiatry. Frontiers in Human Neuroscience, 29 July. [ Free Full Text ] [5] Ibanez-Molina AJ, et al (2016) - Neurocomputational Model of EEG Complexity during Mind Wandering. Front Comput Neurosci. 2016 Mar 4;10:20 [ Free Full Text ] [6] Breakspear M, et al (2005) - Dynamics of a neural system with a multiscale architecture, Phil Trans R Soc B 360, 1051-1074. [ Free Full Text ] [7] Lim M, et al (2016) - Increased Low- and High-Frequency Oscillatory Activity in the Prefrontal Cortex of Fibromyalgia Patients. Frontiers in Human Neuroscience, 14 March. [ Free Full Text ] [8] Bak P (1999) – How Nature Works: The Science of Self-Organized Criticality. Copernicus / Springer-Verlag, NY. [9] Libenson MH (2010) - Practical Approach to Electroencephalography. Saunders, Elsevier. p 6. [10] Pacher P, et al (2007) - Nitric Oxide and Peroxynitrite in Health and Disease. Physiol Rev 97:315-424, 2007. [11] Milham S (2012) - Dirty Electricity - Electrification and the Diseases of Civilization. 2nd Ed. iUniverse Inc, Bloomington.