


Last modified: August 26, 2021

Sickness Behavior (SBeh), TAG Sync & Neurofeedback:
This is my icon for sickness behavior (SBeh). The reversal of sickness behavior is the central
emphasis of my model. We will discuss this icon in detail later. For now please know that the top
circle represents adaptive wellness behavior and rigpa (creative, adaptive natural mind). When
stress exceeds resources the adaptive behavior deteriorates toward ever more finely dissected
ICD and DSM codes represented by the gradations at the base of the sickness behavior
pyramid. Attempts to reestablish wellness behavior (return to center at top) may be dissipated by
patterns of over-control (arrow to the left) and/or patterns of under-control (arrow to the right).
Later we will show how these “dissipations” correspond to the dynamic rigidity and dynamic
lability of Ulrich (2013, “The Theoretical Interpretation of Electroencephalography”) as well as the
concepts of rigid versus random graphs compared to efficient small world networks. This is a
model to use when the adaptive natural mind dissipates into chronic sickness behavior.
By “canonical sickness behavior” I mean programmed apoptosis of the self. (See video “Death by Design”.) In general,
sickness behavior refers to a common pathway in illness in which there is fatigue, loss of pleasure, loss of interest,
disconnection, uncoupling between energy utilization and efficiency, and social, immune and metabolic network failure.
Many of the epigenetic factors can be regulated through mindfulness practice [1]. The physical, mental and social
dissolution is often accompanied by white matter dissolution in the form in decreased fractional anisotropy with diffusion
tensor imaging.
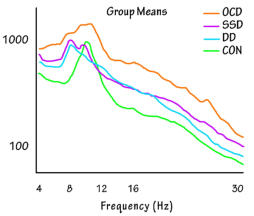
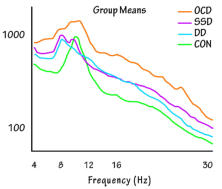
Please spend some time with this very important chart I adapted from
Schulman et al 2011 [2]. OCD = Obsessive-Compulsive Disorder, SSD =
Schizophrenia Spectrum Disorder, DD = Depressive Disorder, and CON =
healthy controls. The vertical scale is an arbitrary scale for EEG amplitude.
For temporary convenience I am going to simply refer to everything here as
“sickness behavior” except for the healthy control shown in green.
What differentiates natural adaptive ability (the green curve to the left as well
as the circle at the top of the SBeh icon above) from sickness behavior (OCD,
SSD, DD) in this chart?
The adaptive EEG (Green) has 1) a sharp alpha peak centered around 10 Hz
and 2) efficient low amplitude production of both low frequency and high
frequency EEG.
Sickness behavior exhibits increased inefficient production of low and high frequency EEG signals plus a distorted peak
control frequency that is either lowered in frequency (DD), or has two discrete peak frequencies (SSD) or has little or no
established control frequency (OCD).
If Neurofeedback did not exist it would be necessary for us to invent it. The above graph seems to suggest that in order
to turn sickness behavior toward wellness behavior we might 1) reduce the amplitude of 4-8 Hz EEG, 2) reduce the
amplitude of 16-30 Hz EEG, and 3) train for a sharp alpha peak around 10 Hz.
Please return to the green “healthy control” curve in the power spectral display above. For each condition the chart has
measured the power produced in multiple frequency “bins” (e.g., 4-5 Hz, 5-6 Hz, 6-7 Hz, etc) averaged over the time of
the recording. For example, because of averaging over time, the large 10 Hz alpha peak in controls would look exactly
the same in each of the following very different situations. A) Alpha declines from high to low power during the recording
period; B) Alpha increases from low to high power during the recording period; C) Alpha is moderate in power and
constant during the recording period; D) Alpha consists of a series of high power alpha bursts interspersed with little or
no alpha production during the recording period. Each of these 4 situations would be expected to respond differently
when there is a clinical change of state. Unfortunately the colored brain maps commonly used in neurotherapy have
thrown away the all the information about dynamics (changes over time) and it can not be reassembled without
consulting the raw EEG. This will be discussed in the section on “theoretical interpretation of electroencephalography”.
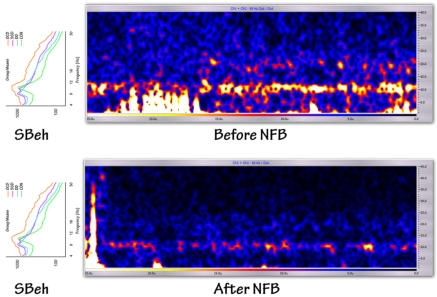
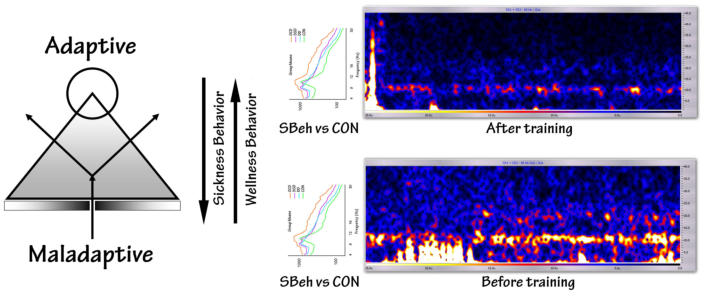
The following illustration shows dynamics of the power spectrum of a client over a period of a few seconds before and
after an effective neurofeedback (NFB) session. The previous chart above (group means) has been turned on its side
so that the frequencies in the chart are aligned with the frequencies in the NFB cascading spectral display, captured
from the popular program BioExplorer. Unlike the group means chart (above) which uses height above the horizontal
axis to indicate power, the NFB spectral display uses color. The warmer and whiter colors are high power and
correspond to the higher peaks in the group means chart above. The NFB spectral display (also called a cascading
chronospectrogram, etc.) shows, using color, how the alpha and other frequencies behave over time, for example,
whether the client is becoming more awake or less awake during the recording. This information is not available in the
traditional NFB brain maps.

References:
[1] Ravnik-Glavac M, et al (2012) - Genome-wide expression changes in a higher state of consciousness.
Consciousness and Cognition 21 (2012) 1322–1344. [Abstract]
[2] Schulman JJ, et al (2011) - Imaging of thalamocortical dysrhythmia in neuropsychiatry. Frontiers in Human
Neuroscience, 29 July. [Free Full Text]
[3] Ulrich G (2013) - The Theoretical Interpretation of Electroencephalography. BMed.
[4] Lee GH, et al (2012) - Middle ear myoclonus associated with forced eyelid closure in children: diagnosis and
treatment outcome. Laryngoscope. 2012 Sep; 122(9): 2071-5. [Abstract]
[5] Panossian A, et al (2005) - Stimulating effect of adaptogens - An overview with particular reference to their
efficacy following single dose administration. Phytotherapy Research, 19, 819-838. [Abstract]
[6] Vincent K, et al (2013) - Altered network communication following a neuroprotective drug treatment. PLoS
One. 2013; 8(1):e54478. [Free Full Text]
[7] Dhond RP, et al (2008) - Acupuncture modulates resting state connectivity in default and sensorimotor brain
networks. Pain. 2008 Jun, 136(3):407-418. [Free Full Text]
[8] Washington SD, et al (2013) - Dysmaturation of the Default Mode Network in Autism. Human Brain Mapping,
Apr;35(4):1284-96. [Free Full Text]
[9] Russell-Chapin L, et al (2013) - The Effects of Neurofeedback in the Default Mode Network - Pilot Study
Results of Medicated Children with ADHD. Routledge Press.
[10] Khalid A, et al (2016) - Gamma oscillation in functional brain networks is involved in the spontaneous
remission of depressive behavior induced by chronic restraint stress in mice. BMC Neurosci (2016) 17:4. [Free
Full Text]
[11] Voorhees JL, et al (2013) - Prolonged restraint stress increases IL-6, reduces IL-10, and causes persistent
depressive-like behavior that is reversed by recombinant IL-10. PLoS One. 2013; 8(3). [Free Full Text]
[12] Liang S, et al (2015) - Administration of Lactobacillus helveticus NS8 improves behavioral, cognitive, and
biochemical aberrations caused by chronic restraint stress. Neuroscience. 2015 Dec 3; 310:561-77. [Free Full
Text]
[13] Pahor A, et al (2014) - Theta–gamma cross-frequency coupling relates to the level of human intelligence.
Intelligence 46 (2014) 283-290. [Abstract]
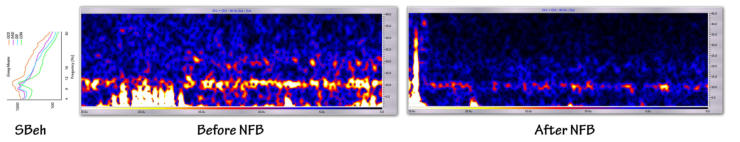
The NFB spectral display uses quantitative EEG methods to provide its live (cascading) output during a session. In our
example (below) at each moment in time we can compare the client’s spectral display with that of the previous few
moments and observe trends such as intrusion of fragments of sleep states. This type of live QEEG guided NFB can
be interpreted in a similar manner as Ulrich’s Ipsative Trend Analysis (ITA) discussed elsewhere.
These 2 cascading spectral displays scroll to the left. That means that at the far right of each display (where the
vertical axis indicates the frequency components) you see the amplitude of each frequency that was being produced
just at the moment the screen capture was completed. The amplitude is represented by color - warmer colors and
white have the highest amplitude. The data at the far left of each display shows the amplitudes of each frequency
produced 30 seconds previously. The displays scroll to the left and display this quantified EEG (QEEG) data. Attention
to detail will show that even though the sensitivity of the instruments was different between the recordings the post-
treatment qEEG data still sees in ipsative trend away from sickness behavior. The Pre-NFB may be described as
“dynamic lability” in Ulrich’s terms [3] or thalamocortical dysrhythmia similar to what Schulman and Llinas’ describe in
MEG. Despite the differences in generation and interpretation between MEG and EEG data, the notion of dissipation of
electromagnetic energy along with the dissolution of its control frequencies is paralleled by reduced fractional
anisotropy in diffusion tensor imaging (DTI).
The loss of efficiency increases the wiring costs such that the functional path length increases. Such loss of small
world network efficiency may be accompanied by intrusion of subvigilant states and failure to harness complexity
through synchronization. You will often observe clients switching between the two states shown in the spectral displays
(below). This may be accompanied by compulsive narrating and rumination.
In the “Before training” cascading spectral display below note the repetitive high voltage low frequency eye movement
artifacts in the first third of the recording. The client was unaware of and had no control of these forced eye movements
that were accompanied by middle ear myoclonus, a thumping type of tinnitus. They were accompanied by sudden
intense negative internal dialogue and anxiety. In the spectral display you can see the characteristic cross frequency
coupling between delta and beta that characterizes social anxiety disorder. This occurs immediately after the forced
eye movements that were accompanied by a large repetitive epileptiform discharge that was found to be palatal
myoclonus. [4] I mention this here to emphasis that this sort of ipsative trend analysis during or between
neurofeedback sessions requires a thorough familiarity with raw EEG as well as the real time operation and
interpretation of the QEEG instrumentation used during training.
Neurofeedback acts like an adaptogen to help self-regulate sickness behavior:
Adaptogens such as herbs and certain pharmaceuticals are substances which are 1) generally nontoxic, 2) have a wide range of application, and 3) epigenetically up-regulate wellness behavior [5]. Adaptogens improve small world efficiency by increasing nodal clustering coefficient (”C”) while reducing average path length between nodes [6]. In 2010 Dhond showed with fMRI that real but not sham acupuncture at point St36 was capable of consolidating the default mode network of the brain [7]. Washington et al (2013) showed that autism involved such dysmaturation of the default mode network (DMN) [8]. In fact St36, the point used by Dhond et al, is a common ancient network point for developmental failure. In 2010 I proposed that NFB acts like an adaptogen to help regulate sickness behavior. In 2013 our team headed by Lori Anne Russell-Chapin at Bradley University showed that standard NFB had a very similar maturational effect on fMRI DMN functioning in adolescents with ADHD [9].The EEG during spontaneous recovery from sickness behavior:
Very few EEG studies have looked at the brain of a group of animals before overwhelming trauma, then immediately afterwards in the symptomatic state, and then later after spontaneous recovery. Khalid A, et al (2016) showed that mice whose lives had been complicated by four weeks of chronic restraint stress used global broad band EEG synchronization to spontaneously recover from the depressive and inflammatory post-traumatic sequelae. [10,11,12] Elsewhere I explain that neurofeedback, used as a sort of technology-assisted self-regulation / self-realization (TASR) promotes the ability of synchrony to harness complexity. When the brain uses more resources to solve a complex problem, it does so accompanied especially by an increased synchronization of the amplitudes of theta and gamma [13, tagsync.com/cfc].
In Progress:
Apoptosis of the self: The importance of network support and neuroplasticity.
EEG in healers and the healed; network efficiency in sickness and healing behavior.
Complexity, Canonical Sickness Behavior, and EEG Biofeedback.


Last mod: Aug 26, 2021
Sickness Behavior (SBeh), TAG Sync & Neurofeedback:
This is my icon for sickness behavior (SBeh). The
reversal of sickness behavior is the central
emphasis of my model. We will discuss this icon in
detail later. For now please know that the top circle
represents adaptive wellness behavior and rigpa
(creative, adaptive natural mind). When stress
exceeds resources the adaptive behavior
deteriorates toward ever more finely dissected ICD
and DSM codes represented by the gradations at
the base of the sickness behavior pyramid.
Attempts to reestablish wellness behavior (return
to center at top) may be dissipated by patterns of over-control (arrow to
the left) and/or patterns of under-control (arrow to the right). Later we will
show how these “dissipations” correspond to the dynamic rigidity and
dynamic lability of Ulrich (2013, “The Theoretical Interpretation of
Electroencephalography”) as well as the concepts of rigid versus random
graphs compared to efficient small world networks. This is a model to use
when the adaptive natural mind dissipates into chronic sickness behavior.
By “canonical sickness behavior” I mean programmed apoptosis of the
self. (See video “Death by Design”.)
In general, sickness behavior refers
to a common pathway in illness in
which there is fatigue, loss of
pleasure, loss of interest,
disconnection, uncoupling between
energy utilization and efficiency, and
social, immune and metabolic
network failure. Many of the
epigenetic factors can be regulated
through mindfulness practice [1]. The
physical, mental and social
dissolution is often accompanied by
white matter dissolution in the form in
decreased fractional anisotropy with diffusion tensor imaging.
Please spend some time with this very important chart I adapted from
Schulman et al 2011 [2]. OCD = Obsessive-Compulsive Disorder, SSD =
Schizophrenia Spectrum Disorder, DD = Depressive Disorder, and CON =
healthy controls. The vertical scale is an arbitrary scale for EEG
amplitude.
For temporary convenience I am going to simply refer to everything here
as “sickness behavior” except for the healthy control shown in green.
What differentiates natural adaptive ability (the green curve to the left as
well as the circle at the top of the SBeh icon above) from sickness
behavior (OCD, SSD, DD) in this chart?
The adaptive EEG (Green) has 1) a sharp alpha peak centered around 10
Hz and 2) efficient low amplitude production of both low frequency and
high frequency EEG.
Sickness behavior exhibits increased inefficient production of low and
high frequency EEG signals plus a distorted peak control frequency that is
either lowered in frequency (DD), or has two discrete peak frequencies
(SSD) or has little or no established control frequency (OCD).
If Neurofeedback did not exist it would be necessary for us to invent it.
The above graph seems to suggest that in order to turn sickness behavior
toward wellness behavior we might 1) reduce the amplitude of 4-8 Hz
EEG, 2) reduce the amplitude of 16-30 Hz EEG, and 3) train for a sharp
alpha peak around 10 Hz.
Please return to the green “healthy control” curve in the power spectral
display above. For each condition the chart has measured the power
produced in multiple frequency “bins” (e.g., 4-5 Hz, 5-6 Hz, 6-7 Hz, etc)
averaged over the time of the recording. For example, because of
averaging over time, the large 10 Hz alpha peak in controls would look
exactly the same in each of the following very different situations. A) Alpha
declines from high to low power during the recording period; B) Alpha
increases from low to high power during the recording period; C) Alpha is
moderate in power and constant during the recording period; D) Alpha
consists of a series of high power alpha bursts interspersed with little or
no alpha production during the recording period. Each of these 4
situations would be expected to respond differently when there is a clinical
change of state. Unfortunately the colored brain maps commonly used in
neurotherapy have thrown away the all the information about dynamics
(changes over time) and it can not be reassembled without consulting the
raw EEG. This will be discussed in the section on “theoretical
interpretation of electroencephalography”.
The following illustration shows dynamics of the power spectrum of a
client over a period of a few seconds before and after an effective
neurofeedback (NFB) session. The previous chart above (group means)
has been turned on its side so that the frequencies in the chart are
aligned with the frequencies in the NFB cascading spectral display,
captured from the popular program BioExplorer. Unlike the group means
chart (above) which uses height above the horizontal axis to indicate
power, the NFB spectral display uses color. The warmer and whiter colors
are high power and correspond to the higher peaks in the group means
chart above. The NFB spectral display (also called a cascading
chronospectrogram, etc.) shows, using color, how the alpha and other
frequencies behave over time, for example, whether the client is
becoming more awake or less awake during the recording. This
information is not available in the traditional NFB brain maps.

The NFB spectral display uses quantitative EEG methods to provide its
live (cascading) output during a session. In our example (below) at each
moment in time we can compare the client’s spectral display with that of
the previous few moments and observe trends such as intrusion of
fragments of sleep states. This type of live QEEG guided NFB can be
interpreted in a similar manner as Ulrich’s Ipsative Trend Analysis (ITA)
discussed elsewhere.
These 2 cascading spectral displays scroll to the left. That means that at
the far right of each display (where the vertical axis indicates the
frequency components) you see the amplitude of each frequency that was
being produced just at the moment the screen capture was completed.
The amplitude is represented by color - warmer colors and white have the
highest amplitude. The data at the far left of each display shows the
amplitudes of each frequency produced 30 seconds previously. The
displays scroll to the left and display this quantified EEG (QEEG) data.
Attention to detail will show that even though the sensitivity of the
instruments was different between the recordings the post-treatment
qEEG data still sees in ipsative trend away from sickness behavior. The
Pre-NFB may be described as “dynamic lability” in Ulrich’s terms [3] or
thalamocortical dysrhythmia similar to what Schulman and Llinas’ describe
in MEG. Despite the differences in generation and interpretation between
MEG and EEG data, the notion of dissipation of electromagnetic energy
along with the dissolution of its control frequencies is paralleled by
reduced fractional anisotropy in diffusion tensor imaging (DTI).
The loss of efficiency increases the wiring costs such that the functional
path length increases. Such loss of small world network efficiency may be
accompanied by intrusion of subvigilant states and failure to harness
complexity through synchronization. You will often observe clients
switching between the two states shown in the spectral displays (below).
This may be accompanied by compulsive narrating and rumination.
In the “Before training” cascading spectral display below note the repetitive
high voltage low frequency eye movement artifacts in the first third of the
recording. The client was unaware of and had no control of these forced
eye movements that were accompanied by middle ear myoclonus, a
thumping type of tinnitus. They were accompanied by sudden intense
negative internal dialogue and anxiety. In the spectral display you can see
the characteristic cross frequency coupling between delta and beta that
characterizes social anxiety disorder. This occurs immediately after the
forced eye movements that were accompanied by a large repetitive
epileptiform discharge that was found to be palatal myoclonus. [4] I
mention this here to emphasis that this sort of ipsative trend analysis
during or between neurofeedback sessions requires a thorough familiarity
with raw EEG as well as the real time operation and interpretation of the
QEEG instrumentation used during training.

Neurofeedback acts like an adaptogen to help self-regulate
sickness behavior:
Adaptogens such as herbs and certain pharmaceuticals are substances which are 1) generally nontoxic, 2) have a wide range of application, and 3) epigenetically up-regulate wellness behavior [5]. Adaptogens improve small world efficiency by increasing nodal clustering coefficient (”C”) while reducing average path length between nodes [6]. In 2010 Dhond showed with fMRI that real but not sham acupuncture at point St36 was capable of consolidating the default mode network of the brain [7]. Washington et al (2013) showed that autism involved such dysmaturation of the default mode network (DMN) [8]. In fact St36, the point used by Dhond et al, is a common ancient network point for developmental failure. In 2010 I proposed that NFB acts like an adaptogen to help regulate sickness behavior. In 2013 our team headed by Lori Anne Russell-Chapin at Bradley University showed that standard NFB had a very similar maturational effect on fMRI DMN functioning in adolescents with ADHD [9].The EEG during spontaneous recovery from sickness
behavior:
Very few EEG studies have looked at the brain of a group of animals before overwhelming trauma, then immediately afterwards in the symptomatic state, and then later after spontaneous recovery. Khalid A, et al (2016) showed that mice whose lives had been complicated by four weeks of chronic restraint stress used global broad band EEG synchronization to spontaneously recover from the depressive and inflammatory post-traumatic sequelae. [10,11,12] Elsewhere I explain that neurofeedback, used as a sort of technology- assisted self-regulation / self-realization (TASR) promotes the ability of synchrony to harness complexity. When the brain uses more resources to solve a complex problem, it does so accompanied especially by an increased synchronization of the amplitudes of theta and gamma [13, tagsync.com/cfc].
In Progress:
Apoptosis of the self: The importance of network support and
neuroplasticity.
EEG in healers and the healed; network efficiency in sickness and
healing behavior.
Complexity, Canonical Sickness Behavior, and EEG Biofeedback.
References:
[1] Ravnik-Glavac M, et al (2012) - Genome-wide expression changes
in a higher state of consciousness. Consciousness and Cognition 21
(2012) 1322–1344. [Abstract]
[2] Schulman JJ, et al (2011) - Imaging of thalamocortical dysrhythmia
in neuropsychiatry. Frontiers in Human Neuroscience, 29 July. [Free
Full Text]
[3] Ulrich G (2013) - The Theoretical Interpretation of
Electroencephalography. BMed.
[4] Lee GH, et al (2012) - Middle ear myoclonus associated with
forced eyelid closure in children: diagnosis and treatment outcome.
Laryngoscope. 2012 Sep; 122(9): 2071-5. [Abstract]
[5] Panossian A, et al (2005) - Stimulating effect of adaptogens - An
overview with particular reference to their efficacy following single
dose administration. Phytotherapy Research, 19, 819-838. [Abstract]
[6] Vincent K, et al (2013) - Altered network communication following
a neuroprotective drug treatment. PLoS One. 2013; 8(1):e54478.
[Free Full Text]
[7] Dhond RP, et al (2008) - Acupuncture modulates resting state
connectivity in default and sensorimotor brain networks. Pain. 2008
Jun, 136(3):407-418. [Free Full Text]
[8] Washington SD, et al (2013) - Dysmaturation of the Default Mode
Network in Autism. Human Brain Mapping, Apr;35(4):1284-96. [Free
Full Text]
[9] Russell-Chapin L, et al (2013) - The Effects of Neurofeedback in
the Default Mode Network - Pilot Study Results of Medicated
Children with ADHD. Routledge Press.
[10] Khalid A, et al (2016) - Gamma oscillation in functional brain
networks is involved in the spontaneous remission of depressive
behavior induced by chronic restraint stress in mice. BMC Neurosci
(2016) 17:4. [Free Full Text]
[11] Voorhees JL, et al (2013) - Prolonged restraint stress increases
IL-6, reduces IL-10, and causes persistent depressive-like behavior
that is reversed by recombinant IL-10. PLoS One. 2013; 8(3). [Free
Full Text]
[12] Liang S, et al (2015) - Administration of Lactobacillus helveticus
NS8 improves behavioral, cognitive, and biochemical aberrations
caused by chronic restraint stress. Neuroscience. 2015 Dec 3;
310:561-77. [Free Full Text]
[13] Pahor A, et al (2014) - Theta–gamma cross-frequency coupling
relates to the level of human intelligence. Intelligence 46 (2014) 283-
290. [Abstract]