


Last modified: August 26, 2021

Complexity, TAG Sync and Neurofeedback:
I chose a simple snowflake for the complexity icon because underneath the seemingly infinite
variety of designs there is a simple law of physics that governs the development of complexity
in all inanimate, animate, and technical designs - Bejan’s Constructal Law of Physics (also see
section on CLaw).
“For a finite-size flow system to persist in time (to live), its configuration must evolve in such a
way that provides easier access to the currents that flow through it.” (Bejan A 2012 - Design in
Nature [1]). The snowflake is a living morphing design to disperse heat to the atmosphere
during freezing. The complexity is a result.
The mind, scientific organizations, communications grids, etc., are all living morphing designs to increase the flow of
information through them. Similarly the evolving diversity and complexity in geological formations, plants and animals
provides more efficient flow of matter, energy and information as well.
There is a growing variety of mathematical methods for calculating complexity such as dimensional complexity,
Lyapunov exponent, approximate entropy, Lempel-Ziv complexity, correlation dimension, Hurst exponent, multiscale
entropy, synchrony coalition entropy and others. These are applied to analysis of behavior as well as to biological
signals such as ECG and EEG. This mathematical complexity is not needed to understand the basic concept that
wellness behavior involves evolution of complexity, and sickness behavior involves loss of complexity. Standard
measures of entropy only measure randomness, but biological complexity grows in a special region between rigidity
and randomness such as in small world networks.

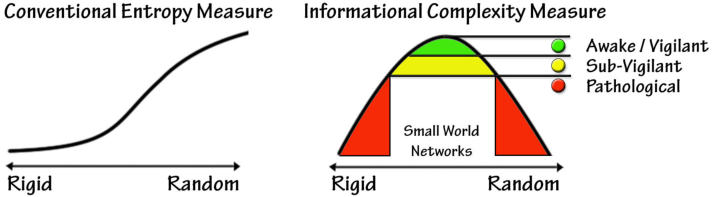
Carhart-Harris et al [2] find that normal waking states have intermediate entropy and are critically located between
low entropy states such anesthesia, deep sleep and coma and high entropy states such as REM sleep and
psychedelic states. "...there is a greater repertoire of connectivity motifs in the psychedelic state than in normal
waking consciousness... entropy suppression furnishes normal waking consciousness with a constrained quality and
associated metacognitive functions, including reality-testing and self-awareness." [2]
Yang et al 2013 state [3], “We propose that mental illness is loss of brain complexity and the complexity of mental
illness can be studied under a general framework by quantifying the order and randomness of dynamic macroscopic
human behavior and microscopic neuronal activity” [2].
Schartner et al (2015) state [4], “Emerging neural theories of consciousness suggest a correlation between a specific
type of neural dynamical complexity and the level of consciousness.” They introduce the novel complexity measure
“synchrony coalition entropy (SCE)” based on “diversity in synchrony patterns”. SCE is low for small phase lag
and also low for large phase lag, but SCE is high for intermediate values “in which synchrony between communities
is able to fluctuate.” The authors point out that “changes in complexity do not simply reflect changes to the overall
power spectrum.”

TAG Sync based neurofeedback is also called
Live Complexity Training (LCT)
in which increased entropy is harnessed by
global broad band synchronization (GBBS) over
small world networks (SWN) operating at or near
self-organized criticality (SOC) according to the
constructal law of physics (CLaw): GBBS / SWN +
SOC & CLaw
Complexity, Vigilance and the EEG:
Gerald Ulrich 2013 [5] describes the appearance and dynamics of the EEG when it represents efficient and adaptive processing of internal and external information. He calls this state vigilance as had Bente and other Europeans before him. I call this state adaptive complexity. Ulrich points out that the EEG can not be used to diagnosis diseases, but it is a global cerebral indicator whose “ipsative” change over time indicates changes between sickness behavior and wellness behavior. Vigilance behavior and EEG indicate full awake adaptive processing of information and when disturbed by stress, disease or altered states can exhibit dynamic rigidity and/or dynamic lability. Later we will discuss the appearance of these changes on the chronospectrogram (cascading spectral display) during neurofeedback. A summary, in very simple terms, is that the constructal law of physics suggests the role of complexity in adaptive evolution. Weakness in this system can lead to sickness behavior and inflammatory white matter damage to small world networks accompanied by intrusions of sleep fragments and other signs of sickness behavior in the EEG.Complexity and Selected Clinical Considerations:
Acupuncture Aging Alzheimer’s Disease & Dementia Anesthesia Attention Autism Cerebral Palsy Chronic Fatigue Syndrome Cognition, Mild Impairment Coma, Pediatric Consciousness Creativity Depression Down Syndrome EEG Recording Executive Functioning Epilepsy Hypoglycemia Mental Illness Obsessive Compulsive Disorder Parkinson’s Disease Pediatrics Posttraumatic Stress Disorder Schizophrenia Sleep Sleepiness StrokeAcupuncture: ▲
“…a new wavelet limited penetrable visibility graph (WLPVG) approach. Manual acupuncture can influence the complexity of EEG sub-bands in different ways and lead the functional brain networks to obtain higher efficiency and stronger small-world property compared with pre-acupuncture control state.” Pei X, et al (2014) - WLPVG approach to the analysis of EEG-based functional brain network under manual acupuncture. Cogn Neurodyn. 2014 Oct; 8(5):417-28. [Abstract] “By analyzing the complexity of five EEG rhythms, it is found that the complexity of delta rhythm during acupuncture is lower than before acupuncture, and for alpha rhythm that is higher, but for beta, theta and gamma rhythms there are no obvious changes. All of those effects are especially obvious during acupuncture with frequency of 200 times/min.” Yi G, et al (2013) - Multi-scale order recurrence quantification analysis of EEG signals evoked by manual acupuncture in healthy subjects. Cogn Neurodyn. 2013 Feb; 7(1):79-88. [Abstract]Aging: ▲
“Considering the general "loss of complexity" theory of aging, our finding of increased EEG complexity in elderly people with heightened creativity supports the idea that creativity is associated with activated neural networks.” Ueno K, et al (2015) - Neurophysiological basis of creativity in healthy elderly people: a multiscale entropy approach. Clin Neurophysiol. 2015 Mar; 126(3):524-31. [Abstract] “We observed that physically active elderly adults had better accuracy on both visuo-spatial attention and working memory conditions relative to their sedentary counterparts. Additionally, these physically active elderly adults displayed greater MSE values at larger time scales at the Fz electrode in both attention and memory conditions.” MSE = Multiscale Entropy. “ Wang CH, et al (2014) - The association of physical activity to neural adaptability during visuo-spatial processing in healthy elderly adults: A multiscale entropy analysis. Brain Cogn. 2014 Oct 29; 92C:73-83. [Abstract] “Thus, the "wisdom of old age' may find its neurophysiological basis in greater complexity of brain dynamics compared to young ages.” “The results confirm the hypothesis: after a jump in the brain dynamics complexity during puberty a linear increase with age is observed. During maturation (7-25 years), the maximum gain in complexity occurs over the frontal associative cortex.” Anokhin AP, et al (1996) - Age increases brain complexity. Electroencephalogr Clin Neurophysiol. 1996 Jul; 99(1):63-8. [Abstract]Alzheimer’s Disease (AD) and Dementia: ▲
AD has 3 main effects on the EEG - 1) slowing, i.e., increased low frequency power plus reduction of mean frequency, 2) reduced complexity and increased regularity of EEG, and 3) loss of synchrony. Labate D, et al - Complexity Analysis of Alzheimer Disease EEG Data through Multiscale Permutation Entropy. Proceedings of the 7th International Workshop on Biosignal Interpretation (BSI2012). [Free Full Text] “A nonlinear measure of complexity, correlation dimension (D2), was calculated. Our results show an increase in D2 in healthy individuals when the eyes are open, in keeping with an increase in information processing. Conversely, in FTLD patients, no increase in D2 occurred in the open eyes condition, and D2 was significantly lower than that observed in controls.” Carlino E, et al (2014) - Nonlinear analysis of electroencephalogram in frontotemporal lobar degeneration. Neuroreport. 2014 May 7; 25(7):496-500. [Abstract] “Increased severity of AD was associated with decreased MSE complexity as measured by short-time scales, and with increased MSE complexity as measured by long-time scales. MSE complexity in EEGs of the temporal and occipitoparietal electrodes correlated significantly with cognitive function. MSE complexity of EEGs in various brain areas was also correlated to subdomains of neuropsychiatric symptoms. MSE analysis revealed abnormal EEG complexity across short- and long-time scales that were correlated to cognitive and neuropsychiatric assessments. The MSE-based EEG complexity analysis may provide a simple and cost-effective method to quantify the severity of cognitive and neuropsychiatric symptoms in AD patients.” Yang AC, et al (2013) - Cognitive and neuropsychiatric correlates of EEG dynamic complexity in patients with Alzheimer's disease. Prog Neuropsychopharmacol Biol Psychiatry. 2013 Dec 2; 47:52-61. [Abstract]Anesthesia: ▲
“...there is a robustly measurable decrease in the complexity of spontaneous EEG during general anaesthesia.” Schartner M, et al (2015) - Complexity of Multi-Dimensional Spontaneous EEG Decreases during Propofol Induced General Anaesthesia. PLoS ONE 10(8): e0133532. [Free Full Text] Using the novel “synchrony coalition entropy” and Kuramoto oscillator simulations the authors show “a robustly measurable decrease in the complexity of spontaneous EEG during general anaesthesia.” Schartner M, et al (2015) - Complexity of Multi-Dimensional Spontaneous EEG Decreases during Propofol Induced General Anaesthesia. PLoS One. 2015 Aug 7; 10(8). [Abstract]Attention: ▲
“...the resting state is associated with near-critical dynamics, in which a high dynamic range and a large repertoire of brain states may be advantageous. In contrast, a focused cognitive task induces subcritical dynamics, which is associated with a lower dynamic range, which in turn may reduce elements of interference affecting task performance.” Fagerholm ED, et al (2015) - Cascades and Cognitive State - Focused Attention Incurs Subcritical Dynamics. The Journal of Neuroscience, March 18, 2015 • 35(11):4626–4634. [Free Full Text]Autism: ▲
“...higher complexity in TD than ASD, in frontal regions in the delta band and occipital-parietal regions in the alpha band, and lower complexity in TD than in ASD in delta (parietal regions), theta (central and temporal regions) and gamma (frontal-central boundary regions); increased short-range connectivity in ASD in the frontal lobe in the delta band and long-range connectivity in the temporal, parietal and occipital lobes in the alpha band. Finally, and perhaps most strikingly, group differences between ASD and TD in complexity and FC appear spatially complementary, such that where FC was elevated in ASD, complexity was reduced (and vice versa).: Ghanbari Y, et al (2015) - Joint analysis of band-specific functional connectivity and signal complexity in autism. J Autism Dev Disord. 2015 Feb; 45(2):444-60. [Abstract] “Along with ECT, the frontocentral region showed decreased EEG complexity at higher temporal scales, whereas the occipital region expressed an increase at lower temporal scales. Furthermore, these changes were associated with clinical improvement associated with the elevation of brain-derived neurotrophic factor, which is a molecular hypothesis of ECT, playing key roles in ASD pathogenesis.” Okazaki R, et al (2015) - Changes in EEG complexity with electroconvulsive therapy in a patient with autism spectrum disorders: a multiscale entropy approach. Front Hum Neurosci. 2015 Feb 26; 9:106. [Free Full Text]Cerebral Palsy: ▲
“...a definitely higher delta and lower theta and alpha powers, and higher EEG complexity in CP patients.” Sajedi F, et al (2013) - Linear and nonlinear analysis of brain dynamics in children with cerebral palsy. Res Dev Disabil. 2013 May; 34(5):1388-96. [Abstract]Chronic Fatigue Syndrome: ▲
“... energy values of δ, θ, and α1 waves significantly increased in the observation group... in the right frontal and left occipital regions... was more significant ... the correlation dimension in the observation group was significantly lower than the control group, suggesting decreased EEG complexity in CFS patients. Wu T, et al (2016) - Electroencephalogram characteristics in patients with chronic fatigue syndrome. Neuropsychiatr Dis Treat. 2016; 12: 241–249. [Free Full Text]Cognition, Mild Impairment: ▲
“...complexity of functional networks involved in the working memory function in MCI subjects is reduced at alpha and theta bands compared with control subjects, and at the theta band this reduction is more pronounced in the whole brain and intra left hemisphere.” Ahmadlou M, et al (2014) - Complexity of functional connectivity networks in mild cognitive impairment subjects during a working memory task. Clin Neurophysiol. 2014 Apr; 125(4):694-702. [Abstract] “These results demonstrate the great promise for scalp EEG spectral and complexity features as noninvasive biomarkers for detection of MCI and early AD.” McBride JC, et al (2014) - Spectral and complexity analysis of scalp EEG characteristics for mild cognitive impairment and early Alzheimer's disease. Comput Methods Programs Biomed. 2014 Apr; 114(2):153-63. [Abstract]Coma, Pediatric: ▲
Children who had a poor outcome following brain injury secondary to cardiac arrest, TBI or stroke, had ... a lower spatial complexity of the synchrony patterns and a lower temporal variability of the synchrony index values at 15 Hz when compared to those patients with a good outcome. Nenadovic V, et al (2014) - Phase synchronization in electroencephalographic recordings prognosticates outcome in paediatric coma. PLoS One. 2014 Apr 21; 9(4): e94942. [Abstract]Consciousness: ▲
“We show that low-frequency power, electroencephalography complexity, and information exchange constitute the most reliable signatures of the conscious state. When combined, these measures synergize to allow an automatic classification of patients' state of consciousness.” Sitt JD, et al (2014) - Large scale screening of neural signatures of consciousness in patients in a vegetative or minimally conscious state. Brain. 2014 Aug; 137(Pt 8):2258-70. [Abstract] “These studies invariably show that the complexity of the cortical response to TMS collapses when consciousness is lost during deep sleep, anesthesia and vegetative state following severe brain injury, while it recovers when consciousness resurges in wakefulness, during dreaming, in the minimally conscious state or locked-in syndrome.” Sarasso S, et al (2014) - Quantifying cortical EEG responses to TMS in (un)consciousness. Clin EEG Neurosci. 2014 Jan; 45(1):40-9. [Abstract] “1) A group of neurons can contribute directly to conscious experience only if it is part of a distributed functional cluster that achieves high integration in hundreds of milliseconds. 2) To sustain conscious experience, it is essential that this functional cluster be highly differentiated, as indicated by high values of complexity.” ...”A strong prediction based on our hypothesis is that the complexity of the dynamic core should correlate with the conscious state of the subject.” Tononi G, et al (1998) - Consciousness and Complexity. Science Vol 282, 4 Dec 1998, 1846-1851.Creativity: ▲
“Considering the general "loss of complexity" theory of aging, our finding of increased EEG complexity in elderly people with heightened creativity supports the idea that creativity is associated with activated neural networks.” Ueno K, et al (2015) - Neurophysiological basis of creativity in healthy elderly people: a multiscale entropy approach. Clin Neurophysiol. 2015 Mar; 126(3):524-31. [Abstract] “Higher frontal EEG complexity during divergent than convergent thinking could be the result of the concurrent activation of a greater number of independently oscillating processing units.” Mölle M, et al (1999) - EEG complexity and performance measures of creative thinking. Psychophysiology. 1999 Jan; 36(1):95-104. [Abstract]Depression: ▲
“Frontal delta power predicted psychological pain while controlling for depressive symptoms, with participants who exhibited less power experiencing greater psychological pain. Frontal fractal dimension asymmetry, a nonlinear measure of complexity, also predicted psychological pain, such that greater left than right complexity was associated with greater psychological pain. Frontal alpha asymmetry did not contribute unique variance to any regression model of psychological pain.” Meerwijk EL, et al (2015) - Resting-state EEG delta power is associated with psychological pain in adults with a history of depression. Biol Psychol. 2015 Feb; 105:106-14. [Abstract] “... aberrant functional connectivity underlies the pathophysiology of depression, which engenders abnormal electroencephalogram (EEG) complexity. ...The decrease in EEG complexity with ECT might be a result of amelioration of functional connectivity in the brain of a depressed patient.” Okazaki R, et al (2013) - Effects of electroconvulsive therapy on neural complexity in patients with depression: report of three cases. J Affect Disord. 2013 Sep 5; 150(2):389-92. [Abstract]Down Syndrome: ▲
“The results showed higher fractality of the DS brain in almost all regions compared to the normal brain, which indicates less centrality and higher irregular or random functioning of the DS brain regions. Also, laterality analysis of the frontal lobe showed that the normal brain had a right frontal laterality of complexity whereas the DS brain had an inverse pattern (left frontal laterality). ...the higher EEG fractality in DS is associated with the higher fractality in the low frequencies (delta and theta), in broad regions of the brain, and the high frequencies (beta and gamma), majorly in the frontal regions.” Hemmati S, et al (2013) - Down syndrome's brain dynamics: analysis of fractality in resting state. Cogn Neurodyn. 2013 Aug; 7(4):333-40. [Abstract]EEG Recording / Neurofeedback: ▲
“complexity was lower for eyes closed than for eyes open conditions.” Ibáñez-Molina AJ, et al (2015) - Multiscale Lempel-Ziv complexity for EEG measures. Clin Neurophysiol. 2015 Mar; 126(3):541-8. [Abstract] “The results showed significantly greater FDs in females compared to males in all brain regions except in lateral and occipital lobes. This indicates a higher complexity of the brain dynamics in females relative to males. ...The results showed that delta, alpha, and beta bands are the frequency bands that contribute most to the gender differences in brain complexity. Furthermore, the lateralization analysis showed the leftward lateralization of complexity in females is greater than in males.” Ahmadi K, et al (2013) - Brain activity of women is more fractal than men. Neurosci Lett. 2013 Feb 22; 535:7- 11. [Abstract] “...the complexity level increased from eyes closed to eyes open condition; and further increased in the case of 3D as compared to 2D game play.” Khairuddin HR, et al (2013) - Analysis of EEG signals regularity in adults during video game play in 2D and 3D. Conf Proc IEEE Eng Med Biol Soc. 2013; 2013:2064-7. [Abstract]Executive Functioning: ▲
”... participants who suffer from poor inhibitory control can efficiently improve their performance with 10min of electrical stimulation, and such cognitive improvement can be effectively traced back to the complexity within the EEG signals via MSE analysis, thereby offering a theoretical basis for clinical intervention via tDCS for deficits in inhibitory control.” Liang WK, et al (2014) - Revealing the brain's adaptability and the transcranial direct current stimulation facilitating effect in inhibitory control by multiscale entropy. Neuroimage. 2014 Apr 15; 90:218-34. [Abstract]Epilepsy: ▲
“...the complexity of EEG signals in the ictal state are decreased, apparently mainly over the frontal and central regions, Weng WC, et al (2015) - Complexity of Multi-Channel Electroencephalogram Signal Analysis in Childhood Absence Epilepsy. PLoS One. 2015 Aug 5; 10(8):e0134083. [Free Full Text] “Recent findings suggest that neural complexity reflecting a number of independent processes in the brain may characterize typical changes during epileptic seizures and may enable to describe preictal dynamics. …there was a statistically significant decrease in PD2 complexity in the preictal period at about 2 minutes before seizure onset in all 64 intracranial channels localized in various brain sites that were included into the analysis and in 3 scalp EEG channels as well.” Bob P, et al (2014) - Preictal dynamics of EEG complexity in intracranially recorded epileptic seizure: a case report. Medicine (Baltimore). 2014 Nov; 93(23):e151. [Abstract]Hypoglycemia: ▲
“A decrease in the complexity of EEG occurs when a state of hypoglycemia is entered, because of a degradation of the EEG long-range temporal correlations.” Fabris C, et al (2014) - Hypoglycemia-related electroencephalogram changes assessed by multiscale entropy. Diabetes Technol Ther. 2014 Oct; 16(10):688-94. [Abstract]Mental Illness: ▲
“that mental illness is loss of brain complexity and the complexity of mental illness can be studied under a general framework by quantifying the order and randomness of dynamic macroscopic human behavior and microscopic neuronal activity.” Yang AC, et al (2013) - Is mental illness complex? From behavior to brain. Prog Neuropsychopharmacol Biol Psychiatry. 2013 Aug 1; 45:253-7. [Abstract]Obsessive Compulsive Disorder (OCD): ▲
“…patients are characterized by lower EEG complexity at both pre-frontal regions and right fronto-temporal locations. Our results are compatible with imaging studies that define OCD as a sub group of anxiety disorders that exhibited a decreased complexity (such as anorexia nervosa and panic disorder).” Aydin S, et al (2015) - Classification of obsessive compulsive disorder by EEG complexity and hemispheric dependency measurements. Int J Neural Syst. 2015 May; 25(3):1550010. [Abstract]Parkinson’s Disease: ▲
“...increased biosignal complexity, as revealed by MSE analysis, was found in patients with PD during non-REM sleep at high TSFs. This finding might reflect a compensatory mechanism for early defects in neuronal network control machinery in PD.” (MSE = Multiscale Entropy) Chung CC. et al (2013) - Multiscale entropy analysis of electroencephalography during sleep in patients with Parkinson disease. Clin EEG Neurosci. 2013 Jul; 44(3):221-6. [Abstract]Pediatrics: ▲
“Based on the hypothesis that EEG-derived complexity increases with neurophysiological maturation as supported by previously published research, SSC (skin-to-skin contact) accelerates brain maturation in healthy preterm infants as quantified by time series measures of predictability when compared to a similar non-SSC group.” Kaffashi F, et al (2013) - An analysis of the kangaroo care intervention using neonatal EEG complexity: a preliminary study. Clin Neurophysiol. 2013 Feb; 124(2):238-46. [Abstract]PTSD: ▲
Live Complexity Training neurofeedback (LCT) stresses the use of the live qEEG spectral data to signal and train awareness of state changes such as rumination. “Repetitive and anticipatory rumination should be assessed in the context of comorbid PTSD and MDD and interventions should focus on reducing these rumination subtypes.” Roley ME, et al (2015) - The relationship between rumination, PTSD, and depression symptoms. J Affect Disord. 2015 Jul 15; 180:116-21. [Abstract] “PTSD patients have globally reduced complexity in their EEG waveforms. This study supports the hypotheses that PTSD patients exhibit disturbed cortical information processing, and that non-linear dynamical analysis of the EEG can be a tool for detecting changes in neurodynamics of the brain in PTSD.” Chae JH, et al (2004) - Dimensional complexity of the EEG in patients with posttraumatic stress disorder. Psychiatry Res Neuroimaging. 2004 May 30; 131(1):79-89. [Abstract]Schizophrenia: ▲
“multiscale entropy measures identified abnormal dynamical EEG signal complexity in anterior brain areas in schizophrenia that normalized selectively in fronto-central areas with antipsychotic treatment.” Takahashi T, et al (2010) - Antipsychotics reverse abnormal EEG complexity in drug-naive schizophrenia: a multiscale entropy analysis. Neuroimage. 2010 May 15; 51(1):173-82. [Abstract] “It was found that, compared to the controls, anterior alpha Omega and dimensional complexity are higher in schizophrenia patients (p<0.05) with the single channel local omega complexity differentials (LCD) also increasing at FP1, FP2, F7 and F8 electrodes. Furthermore, higher left hemisphere dimensional complexity and LCD at T3 point was also found. The results suggest there is lower connectivity in the pre-frontal and left temporal regions with respect to the alpha band in schizophrenia patients.” Peng H, et al (2013) - A study on validity of cortical alpha connectivity for schizophrenia. Conf Proc IEEE Eng Med Biol Soc. 2013; 2013:3286-90. [Abstract]Sleep: ▲
“…activated brain states-waking and rapid eye movement (REM) sleep are characterized by higher LZC compared with non-rapid eye movement (NREM) sleep.” Abásolo D, et al (2015) - Lempel-Ziv complexity of cortical activity during sleep and waking in rats. J Neurophysiol. 2015 Apr 1; 113(7):2742-52. [Abstract] “After CPAP treatment, FD of EEG in non-rapid eye movement (NREM) sleep decreased significantly (P < 0.05), while FD of EEG increased in rapid eye movement (REM) sleep.” FD means fractal dimension and is a measure of entropy/complexity. Zhang C, et al (2015) - The effect of CPAP treatment on EEG of OSAS patients. Sleep Breath. 2015 Mar 14. [Abstract] “Children with SDB (sleep disordered breathing) showed less complex EEG dynamics in non-REM sleep that was unrelated to the respiratory phase. In REM sleep normal children showed a respiratory phase-related reduction in EEG variability during the expiratory phase compared to inspiration, which was not apparent in children with SDB.” Immanuel SA, et al (2014) - Symbolic dynamics of respiratory cycle related sleep EEG in children with sleep disordered breathing. Conf Proc IEEE Eng Med Biol Soc. 2014; 2014:6016-9. [Abstract] Sleepiness: ▲ “Without daytime sleepiness (WDS) group presented more complexity than excessive daytime sleepiness (EDS) in the occipital zone, while a stronger nonlinear coupling between occipital and frontal zones was detected in EDS patients than in WDS.” Melia U, et al (2015) - Mutual information measures applied to EEG signals for sleepiness characterization. Med Eng Phys. 2015 Mar; 37(3):297-308. [Abstract] The WDS group presented more complexity in the occipital zone than the EDS group, while a stronger nonlinear coupling between the occipital and frontal regions was detected in EDS patients than in the WDS group. Melia U. et al (2014) - Correntropy measures to detect daytime sleepiness from EEG signals. Physiol Meas. 2014 Oct; 35(10):2067-83. [Abstract] Stroke: ▲ “Perilesional tissue exhibited a general slowing of the power spectrum(increased delta/theta, decreased beta) as well as a reduction in MSE.” - Multi-Scale Entropy. Chu RK (2015) - MEG-based detection and localization of perilesional dysfunction in chronic stroke. Neuroimage Clin. 2015 Apr 8; 8:157-69. [Free Full Text] Higuchi Fractal Dimensionality “decrease was associated to alpha increase and beta decrease of oscillatory activity power. ... This picture is coherent with neuronal activity complexity decrease paired to a reduced repertoire of functional abilities.” Zappasodi F, et al (2014) - Fractal dimension of EEG activity senses neuronal impairment in acute stroke. PLoS One. 2014 Jun 26; 9(6):e100199. [Free Full Text]General References:
[1] Bejan A, et al (2012) - Design in Nature. Viking. [2] Carhart-Harris RL, et al (2014) - The entropic brain - A theory of conscious states informed by neuroimaging research with psychedelic drugs. Frontiers in Human Neuroscience, 03 February 2014. [Free Full Text] [3] Yang AC, et al (2013) - Is mental illness complex - From behavior to brain. Progress in Neuro- Psychopharmacology & Biological Psychiatry. 45 (2013) 253-257. [Abstract] [4] Schartner M, et al (2015) - Complexity of Multi-Dimensional Spontaneous EEG Decreases during Propofol Induced General Anaesthesia. PLoS ONE 10(8): e0133532. [Free Full Text] [5] Ulrich G (2013) - The Theoretical Interpretation of Electroencephalography. BMed.


Last mod: Aug 26, 2021

Complexity, TAG Sync and Neurofeedback:
I chose a simple snowflake for the complexity
icon because underneath the seemingly infinite
variety of designs there is a simple law of physics
that governs the development of complexity in all
inanimate, animate, and technical designs -
Bejan’s Constructal Law of Physics (also see
section on CLaw).
“For a finite-size flow system to persist in time (to
live), its configuration must evolve in such a way
that provides easier access to the currents that flow through it.” (Bejan A
2012 - Design in Nature [1]). The snowflake is a living morphing design to
disperse heat to the atmosphere during freezing. The complexity is a
result.
The mind, scientific organizations, communications grids, etc., are all
living morphing designs to increase the flow of information through them.
Similarly the evolving diversity and complexity in geological formations,
plants and animals provides more efficient flow of matter, energy and
information as well.
There is a growing variety of mathematical methods for calculating
complexity such as dimensional complexity, Lyapunov exponent,
approximate entropy, Lempel-Ziv complexity, correlation dimension, Hurst
exponent, multiscale entropy, synchrony coalition entropy and others.
These are applied to analysis of behavior as well as to biological signals
such as ECG and EEG. This mathematical complexity is not needed to
understand the basic concept that wellness behavior involves evolution
of complexity, and sickness behavior involves loss of complexity.
Standard measures of entropy only measure randomness, but biological
complexity grows in a special region between rigidity and randomness
such as in small world networks.


Carhart-Harris et al [2] find that normal waking states have intermediate
entropy and are critically located between low entropy states such
anesthesia, deep sleep and coma and high entropy states such as REM
sleep and psychedelic states. "...there is a greater repertoire of
connectivity motifs in the psychedelic state than in normal waking
consciousness... entropy suppression furnishes normal waking
consciousness with a constrained quality and associated metacognitive
functions, including reality-testing and self-awareness." [2]
Yang et al 2013 state [3], “We propose that mental illness is loss of
brain complexity and the complexity of mental illness can be studied
under a general framework by quantifying the order and randomness of
dynamic macroscopic human behavior and microscopic neuronal activity”
[2].
Schartner et al (2015) state [4], “Emerging neural theories of
consciousness suggest a correlation between a specific type of neural
dynamical complexity and the level of consciousness.” They introduce the
novel complexity measure “synchrony coalition entropy (SCE)” based
on “diversity in synchrony patterns”. SCE is low for small phase lag
and also low for large phase lag, but SCE is high for intermediate values
“in which synchrony between communities is able to fluctuate.” The
authors point out that “changes in complexity do not simply reflect
changes to the overall power spectrum.”

TAG Sync based neurofeedback is also called
Live Complexity Training (LCT)
in which increased entropy is harnessed by
global broad band synchronization (GBBS) over
small world networks (SWN) operating at or near
self-organized criticality (SOC) according to the
constructal law of physics (CLaw):
GBBS / SWN + SOC & CLaw